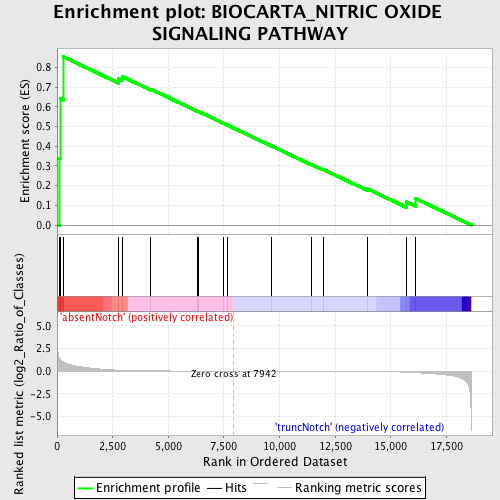
Profile of the Running ES Score & Positions of GeneSet Members on the Rank Ordered List
| Dataset | Set_03_absentNotch_versus_truncNotch.phenotype_absentNotch_versus_truncNotch.cls #absentNotch_versus_truncNotch.phenotype_absentNotch_versus_truncNotch.cls #absentNotch_versus_truncNotch_repos |
| Phenotype | phenotype_absentNotch_versus_truncNotch.cls#absentNotch_versus_truncNotch_repos |
| Upregulated in class | absentNotch |
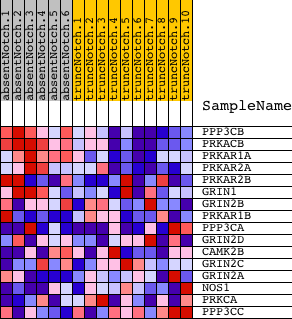
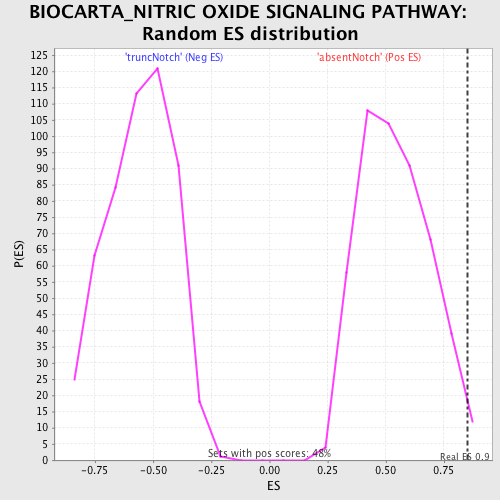
| GeneSet | BIOCARTA_NITRIC OXIDE SIGNALING PATHWAY |
| Enrichment Score (ES) | 0.85302275 |
| Normalized Enrichment Score (NES) | 1.5782574 |
| Nominal p-value | 0.006198347 |
| FDR q-value | 0.30519548 |
| FWER p-Value | 0.819 |
| PROBE | DESCRIPTION (from dataset) | GENE SYMBOL | GENE_TITLE | RANK IN GENE LIST | RANK METRIC SCORE | RUNNING ES | CORE ENRICHMENT | |
|---|---|---|---|---|---|---|---|---|
| 1 | PPP3CB | 6020156 | 90 | 1.527 | 0.3382 | Yes | ||
| 2 | PRKACB | 4210170 | 131 | 1.364 | 0.6426 | Yes | ||
| 3 | PRKAR1A | 3450369 | 290 | 0.974 | 0.8530 | Yes | ||
| 4 | PRKAR2A | 2340136 | 2762 | 0.100 | 0.7426 | No | ||
| 5 | PRKAR2B | 3130593 5220577 | 2919 | 0.087 | 0.7537 | No | ||
| 6 | GRIN1 | 3800014 7000609 | 4218 | 0.023 | 0.6891 | No | ||
| 7 | GRIN2B | 3800333 | 6310 | 0.005 | 0.5777 | No | ||
| 8 | PRKAR1B | 6130411 | 6351 | 0.005 | 0.5766 | No | ||
| 9 | PPP3CA | 4760332 6760092 | 7460 | 0.001 | 0.5173 | No | ||
| 10 | GRIN2D | 6620372 | 7667 | 0.001 | 0.5063 | No | ||
| 11 | CAMK2B | 2760041 | 9644 | -0.004 | 0.4011 | No | ||
| 12 | GRIN2C | 1500538 | 11432 | -0.011 | 0.3075 | No | ||
| 13 | GRIN2A | 6550538 | 11957 | -0.014 | 0.2824 | No | ||
| 14 | NOS1 | 5860129 | 13963 | -0.038 | 0.1832 | No | ||
| 15 | PRKCA | 6400551 | 15714 | -0.124 | 0.1171 | No | ||
| 16 | PPP3CC | 2450139 | 16120 | -0.173 | 0.1342 | No |